
Our research team releases regular monthly housing trends reports. These reports break down inventory metrics like the number of active listings and the pace of the market. In addition, we continue to give readers more timely weekly updates, an effort that began in response to the rapid changes in the economy and housing as a result of the COVID-19 pandemic. Generally, you can look forward to a Weekly Housing Trends View and the latest weekly housing data on Thursdays and regular video updates from our economists monthly. Here’s what the housing market looked like over the last week.
What this Week’s Data Means:
For the third consecutive week, the median home listing price maintained a slight upward trajectory, growing slightly compared to August of last year although it is unlikely to surpass a historical high established in June of last year. At the same time, the supply of available homes declined compared to the previous year due to sellers continuing to hold off from listing their properties. Notably, the Freddie Mac fixed rate for a 30 year mortgage reached 6.96% in the past week, as mortgage rates further intensified the challenge of affordability for potential buyers and effectively anchored prospective sellers from listing their residences.
As we look to the upcoming autumn season which is typically the best time to buy a home, a glimmer of optimism emerges, as it does appear that more newly listed homes could be available than the record low set last fall and winter if the current trend of a narrowing gap continues. However, it is still important to note that the supply of newly listed homes and the overall inventory available for sale are anticipated to remain constrained, staying well-below pre-pandemic levels as we approach the latter months of this year.
Key Findings:
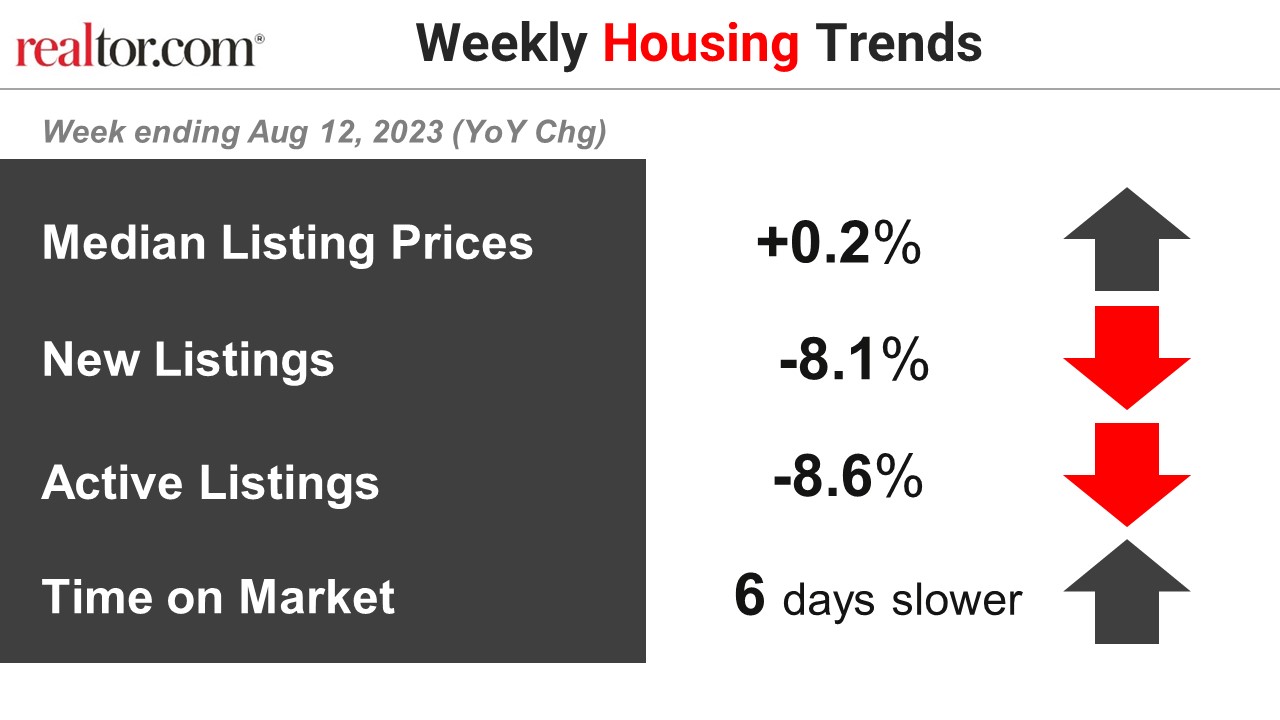
- The median listing price grew by 0.2% over last year.
Median listing prices rose on an annual basis for the third week in a row, after price declines through much of June and July. This past week, the nation’s median home listing price grew by 0.2% over the same week last year. However, despite listing prices being slightly higher than in August of last year, the median listing price is unlikely to surpass the June 2022 high of $449,000 as the median listing price has begun its typical seasonal decline and has declined or remained the same week-over-week for the past five weeks.
- New listings–a measure of sellers putting homes up for sale–were down again this week, by 8.1% from one year ago.
For 58 weeks, there have been fewer newly listed homes compared to the same time one year ago. However, this gap has been shrinking as we start to compare against low new listings in the latter months of 2022. This week’s data shows a 5.9 percentage point improvement over last week as the market slowly trends in a more buyer-friendly direction. While it’s likely that we might see more new listings this fall than the previous year, inventory will continue to remain constrained as listings are still more than 20% below typical pre-pandemic levels seen this time of year. In the meantime, new construction offers buyers an alternative, and new home sales continue to climb from year ago lows.
- Active inventory declined, with for-sale homes lagging behind year ago levels by 8.6%.
This past week marked the 8th consecutive decline in the number of homes actively for sale compared to the prior year, however the gap narrowed slightly compared to the previous week’s -9.1% figure. The existing home sales pace has been roughly consistent at a low level in recent months, suggesting home shoppers are looking. But the continued drag from existing homeowners choosing to stay put is holding back overall inventory. We expect a dip of 5% for 2023 overall compared to 2022.
- Homes spent 6 extra days on the market compared to this time last year.
For more than a year (56 weeks in a row), the time a typical home has been on the market is up compared to the same time one year ago, but the gap has been generally declining this year. This past week, the gap shrank to the smallest gap in annual time on market growth since September 2022. This week’s gap was just 6 days, compared to 7 days last week and 8 the week before. As we lap the 2022 housing slowdown period, this gap is likely to continue to shrink, and by fall we could even see homes selling faster than one year ago. If this happens, it could indicate that the market is finding a new normal, where homes sit on the market for fewer days than pre-pandemic, but longer than was common during the height of the real estate frenzy.
Data Summary:
| All Changes year-over-year | Year-to-Date 2023 | Week ending July 29, 2023 | Week ending August 5, 2023 | Week ending August 12, 2023 |
| Median Listing Prices | 3.4% | 0.2% | 0.7% | 0.2% |
| New Listings | -19.9% | -16.5% | -14.0% | -8.1% |
| Active Listings | +33.0% | -8.6% | -9.1% | -8.6% |
| Time on Market | 15 days slower | 8 days slower | 7 days slower | 6 days slower |
Subscribe to our mailing list to receive updates and notifications on the latest data and research.